Evaluating Recommender Systems
Outlining and exploring the mathematics behind different evaluation strategies and metrics applicable in the recommender systems domain.
Recommender systems are integral to many online platforms, from streaming services to e-commerce websites. They help users navigate through vast amounts of data by suggesting useful items that might be interesting.
However, building effective recommender systems is only part of the challenge, evaluating their performance is equally crucial.
In this post, we'll explore and get to know various methods and metrics used to evaluate recommender systems, ensuring they meet user needs and expectations.
Categories of Evaluation Experiments
Evaluating recommender systems can be broadly categorized into three types of experiments:
- Offline Testing: This involves using static datasets, often historical data, to test the system. Techniques like cross-validation and temporal splits are common. The main advantage is that it doesn't require real users, making it cost-effective and easy to implement.
- Online Testing: This method tests the system "in the wild" with real users. A/B testing is a popular approach, where different groups of users are exposed to recommendations from different systems. This method is predominantly used by industries with access to a large user base.
- User Studies: These involve direct interaction with users, typically through questionnaires or interviews. User studies can be quantitative or qualitative and are designed to gather detailed feedback on user experience and satisfaction.
Evaluating Recommender Systems
Recommender systems can be evaluated from different perspectives: as a retrieval task, a classification task or a user-centric task.
Evaluation Under Retrieval Aspects
When viewed as a retrieval task, the goal is to compare predicted user-item interactions with known interactions.
Performance measures used in information retrieval (IR) can be applied.
Recall and Precision
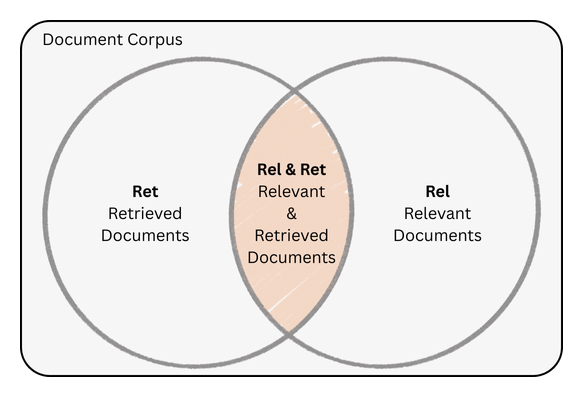
Recall measures the fraction of relevant items that are successfully recommended.
$$\text{Recall} = \frac{|\text{Rel} \cap \text{Ret}|}{|\textcolor{brown}{\text{Rel}}|}$$
Recall is important for discovery (e.g., music platforms) where missing a hit song is a failure.
Precision measure the fraction of recommended items that are relevant.
$$\text{Precision} = \frac{|\text{Rel} \cap \text{Ret}|}{|\textcolor{blue}{\text{Ret}}|}$$
Precision is critical for high-stakes scenarios (e.g., medical recommendations) where irrelevant items harm trust.
Here, $\text{Rel}$ is the set of all relevant items, and $\text{Ret}$ is the set of retrieved (recommended) items.
High Recall or High Precision?
If the goal is to ensure that all potentially relevant items are recommended, high recall is important. This is useful in contexts where missing a relevant item could be detrimental.
If the primary goal is to ensure that most of the recommended items are relevant to the user, high precision is crucial. This is particularly essential in contexts where user trust and satisfaction are key, as irrelevant recommendations can frustrate users.
In many real-world applications, a balance between precision and recall is necessary. This balance can be achieved using metrics like the F-score
F-measure
The F-measure, sometimes also called F1-score or F-score is defined as the harmonic mean of precision and recall, providing a single score that balances both concerns.
$$F = 2 \times \frac{\text{Precision} \times \text{Recall}}{\text{Precision} + \text{Recall}}$$
Precision@k (P@k)
Precision@k assumes that users are only interested in the top $k$ recommended items, hence $P@1$ checks only the first retrieved item, whereas $P@10$ would evaluate for the first 10 retrieved items.
$$P@k = \frac{|\text{Rel} \cap \text{Ret}[1 .. k]|}{k}$$
Average Precision (AP)
Average Precision (AP) is a metric that evaluates how well a ranking system places relevant items at the top of its results.
Unlike simple precision (which only checks correctness at a single cutoff), AP considers all possible ranking positions $[1 .. k]$ where relevant items appear and computes an average of the precision at each of those points.
$$AP = \frac{1}{|\text{Rel}|} \times \sum_{i=1}^{|\text{Ret}|} \text{relevant(i)} \times P@i$$
where $\text{relevant(i)}$ is defined as an indicator function which returns $1$ if the $i$-th retrieved item is relevant and $0$ otherwise. It checks whether the item at position $i$ in the retrieved list is relevant.
R-Precision
R-Precision is a retrieval metric that evaluates precision at a rank equal to the total number of relevant items (R) for a given user.
It assumes there are exactly R relevant items, those known to be liked or useful to the user. The metric then measures precision at the R-th position in the ranked results (P@R), checking how many of the top R recommendations are actually relevant.
$$\text{R-Precision} = \frac{|\text{Rel} \cap \text{Ret}_{\text{top R}}|}{|\text{Rel}|}$$
where $\text{top R}$ represents the $R$ relevant documents for the user.
Reciprocal Rank (RR)
This metric assumes that users are satisfied after encountering the first relevant item.
Hence, we calculate the inverse of the position (rank) of the first retrieved item that is also relevant.
$$RR = \frac{1}{min_k\{ \text{Ret}[k] \in \text{Rel} \}}$$
Mean Average Precision (MAP)
Mean Average Precision provides a single-figure summary of precision performance by averaging Average Precision (AP) scores over all queries/users $I$
$$MAP = \frac{\sum_{i=1}^{|I|} AP(i)}{|I|}$$
Cumulative Gain (CG)
Cumulative Gain (CG) is a straightforward ranking metric that sums the relevance scores of items up to a given position k in a ranked list.
$$\text{CG@k} = \sum_{i=1}^k \text{relevance}(i)$$
Here, relevance(i) represents the relevance score of the item at position i, which can be binary (e.g., 0 or 1) or graded (e.g., a similarity score). CG treats all positions equally, meaning an item’s contribution to the total score does not depend on its rank.
CG is useful when the goal is to measure the total relevance of the top-k items without considering their order.
The primary limitation of CG is that it ignores the position of relevant items. In real-world applications, users are more likely to interact with top-ranked results, so a highly relevant item buried deep in the list should contribute less to the overall score.
Discounted Cumulative Gain (DCG)
Discounted Cumulative Gain (DCG) addresses the key weakness of CG by incorporating position-based discounting, reflecting the diminishing returns of relevance as items appear lower in the ranking.
$$\text{DCG@k} = \text{relevance}(1) + \sum_{i=2}^k \frac{\text{relevance}(i)}{\log_2(i)}$$
Here, the relevance of the first item (relevance(1)) is taken at full value, while subsequent items are discounted by $\log_2(i)$, a monotonically increasing function that penalizes lower ranks more heavily. This logarithmic discount ensures that relevance contributions decrease smoothly as rank increases, aligning with the observation that users are less likely to examine lower-ranked items.
DCG is more realistic than CG for evaluating ranked lists, as it accounts for the position bias inherent in user behavior.
While DCG improves upon CG, it is not normalized, meaning its absolute values cannot be directly compared across different queries or datasets.
A DCG score of 5 for one query may represent excellent performance, while the same score for another query (with higher-relevance items) may be suboptimal.
Normalized Discounted Cumulative Gain (nDCG)
Normalized Discounted Cumulative Gain (nDCG) resolves DCG’s comparability issue by scaling the score relative to the ideal ranking (the best possible DCG achievable for a given set of items).
$$\text{nDCG@k} = \frac{\text{DCG@k}}{\text{IDCG@k}}$$
where IDCG@k (Ideal DCG at k) is computed by sorting all items in descending order of relevance and applying the DCG formula to this optimal ranking. Since nDCG is a ratio, it ranges from 0 to 1, with 1 indicating a perfect ranking.
The key innovation in nDCG is normalization via IDCG, which allows fair comparisons across different queries, users, or datasets. Without normalization, DCG scores are only meaningful in relative terms (e.g., comparing two systems on the same query). nDCG standardizes performance, making it possible to aggregate metrics across multiple evaluations.
Evaluation Under Classification Aspects
When viewed as a classification task, the goal is to predict ratings for unknown items based on known user ratings.
Mean Absolute Error (MAE)
The Mean Absolute Error metric measures the average absolute difference between predicted and true ratings.
$$MAE = \frac{1}{|T|} \sum_{(u,i) \in T} |\hat r_{u,i} - r_{u,i}|$$
where $T$ represents the test set, which is a set of pairs $(u,i)$ where $u$ denotes a user and $i$ denotes an item.
Root Mean Squared Error (RMSE)
RMSE measures the square root of the average squared difference between predicted and true ratings, disproportionally penalizing large prediction errors.
$$RMSE = \sqrt{\frac{1}{|T|} \sum_{(u,i) \in T} (\hat r_{u,i} - r_{u,i})^2 }$$
User-Centric Evaluation
Unlike the traditional quantitative metrics we discussed up until now, which focus on accuracy and performance, user-centric evaluation delves into the qualitative aspects of user experience.
Beyond-Accuracy Metrics
Beyond-Accuracy Metrics aim to capture aspects of the user experience that go beyond simple accuracy measures. These metrics provide a more holistic view of how well a recommender system performs in real-world scenarios.
- Diversity ensures that the recommended items are not too similar, thereby providing a richer and more engaging user experience.
- Novelty measures the ability of a recommender system to introduce users to new and unexpected items. High novelty can enhance user satisfaction by helping them discover items they might not have found otherwise.
- Coverage measures the ability of a recommender system to serve all users and give each item a chance to be recommended.
- Serendipity captures the ability of a recommender system to surprise and delight users by recommending items that are unexpected yet relevant.
- Explainability refers to the ability of a recommender system to provide clear and understandable reasons for its recommendations.
Questionnaires
Questionnaires are a valuable tool for gathering detailed feedback on user experience and satisfaction. They can be designed using quantitative and qualitative methods to capture a wide range of user perceptions and experiences.
- Quantitative Methods involve structured questions with predefined response options, such as Likert scale ratings or manual accuracy feedback. They are useful for gathering numerical data that can be analysed statistically.
- Qualitative Methods involve open-ended questions and structured interviews to gather detailed and nuanced feedback, such as open-question surveys, structured interviews or diary studies.
Conclusion
Evaluating recommender systems involves a combination of offline testing, online testing, and user studies. Different perspectives, such as information retrieval, machine learning, and user-centric evaluation, provide a comprehensive view of the system's performance.
Metrics like recall, precision, F-measure, MAE, RMSE, and beyond-accuracy metrics help ensure that the recommender system meets user needs and expectations.
By understanding and applying these evaluation methods, developers can build more effective and user-friendly recommender systems, ultimately enhancing the user experience and satisfaction.